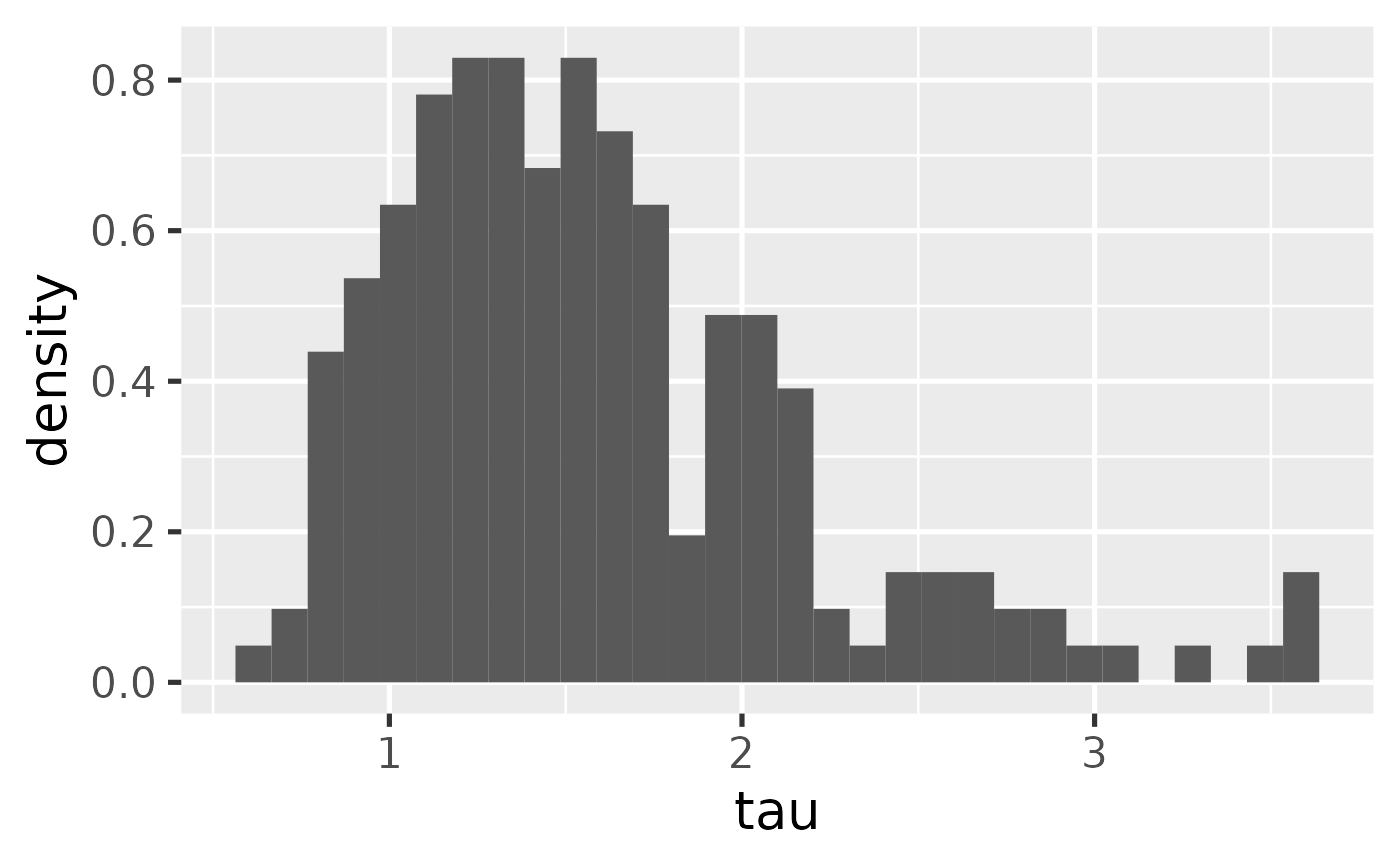
Plot the tau parameter of a fitted hierarchical model.
Arguments
- mcmc
Data frame of posterior samples generated by
hb_mcmc_hierarchical().
See also
Other plot:
hb_plot_borrow(),
hb_plot_group()
Examples
data <- hb_sim_independent(n_continuous = 2)$data
mcmc <- hb_mcmc_hierarchical(
  data,
  n_chains = 1,
  n_adapt = 100,
  n_warmup = 100,
  n_iterations = 200
)
hb_plot_tau(mcmc = mcmc)
#> Warning: The dot-dot notation (`..density..`) was deprecated in ggplot2 3.4.0.
#> ℹ Please use `after_stat(density)` instead.
#> ℹ The deprecated feature was likely used in the historicalborrow package.
#>   Please report the issue at
#>   <https://github.com/wlandau/historicalborrow/issues>.